Enterprise SaaS Analytics & Operations Dashboard
Engineered a high-throughput operational intelligence dashboard rendering real-time telemetry and complex data visualizations across millions of event records.
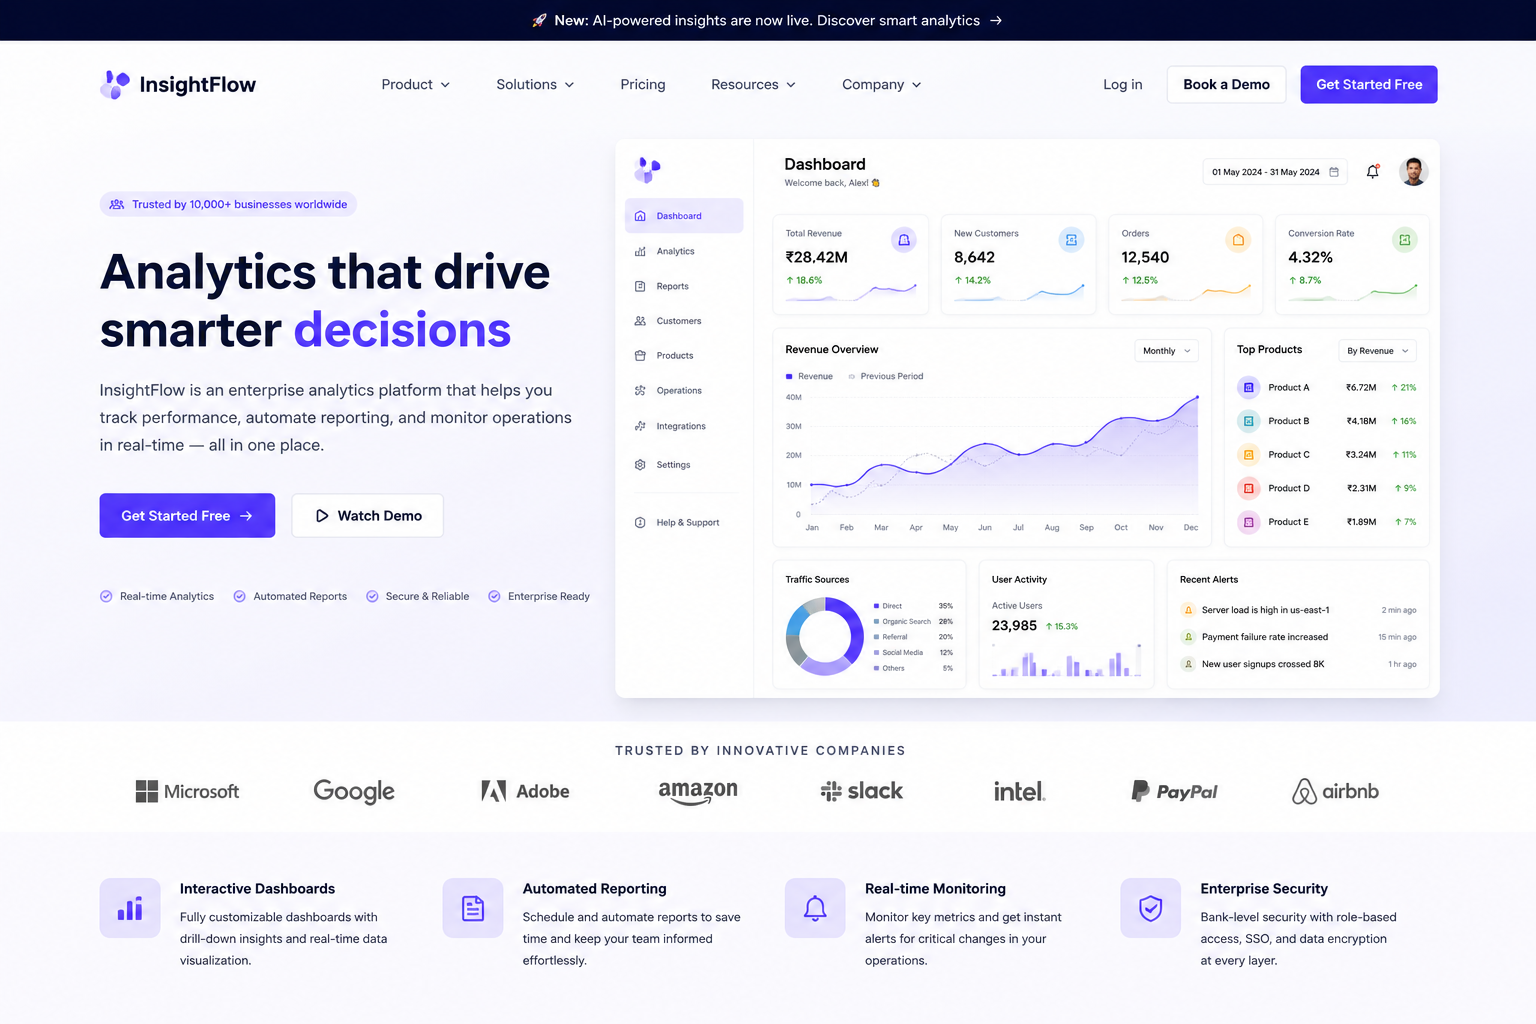
Project Context & Business Overview
An enterprise software company needed a centralized management console to help organizational managers visualize system performance metrics, monitor live IoT device statuses, and export audit compliance reports in real time.
The Problem & Operational Inefficiencies
Existing dashboards suffered from memory leaks and browser freezing when rendering datasets exceeding 20,000 data points.
Real-time alerts were delayed by up to 5 minutes due to continuous HTTP polling architecture.
Data export processes blocked the primary UI thread, preventing users from continuing work while downloading reports.
Core Engineering Requirements
- Virtual scrolling tables capable of rendering 100,000+ data rows with zero frame drops.
- Sub-second alert dispatch using persistent WebSocket bidirectional channels.
- Role-based data masking ensuring regional managers only view data for authorized subsidiaries.
- Background worker threads for compiling multi-megabyte CSV and PDF compliance exports.
The Architectural Solution
Engineered a modular React application utilizing `@tanstack/react-virtual` for DOM windowing and Web Workers for off-thread calculation.
Implemented a pub/sub WebSocket communication layer via Socket.io with Redis message brokers to push telemetry updates under 200ms.
Constructed custom interactive time-series charts using lightweight SVG/Canvas rendering, minimizing CPU overhead.
Key Features & Capabilities Delivered
Virtual Windowed Data Tables
Maintains smooth 60fps scrolling performance regardless of whether the table contains 100 or 100,000 active records.
Sub-Second Alerting Matrix
Real-time visual badges and browser notifications triggered instantly when equipment telemetry breaches predefined thresholds.
Asynchronous Report Exporter
Generates heavy CSV and PDF compliance reports in background worker processes with instant notification on completion.
Key Implementation Details
Engineering Learnings & Takeaways
DOM virtualization is non-negotiable for enterprise SaaS applications handling extensive data tables.
Delegating heavy formatting and sorting logic to Web Workers prevents user interface jitter during data updates.
Technology Stack
Custom Web Application Development
Discover how our engineering team applies these methodologies to bespoke client projects.
Explore Custom Web Application DevelopmentHave a Similar Project?
Get in touch with our team in Noida for an architectural feasibility review and milestone quote.
Start Project Discussion